|
Introduction
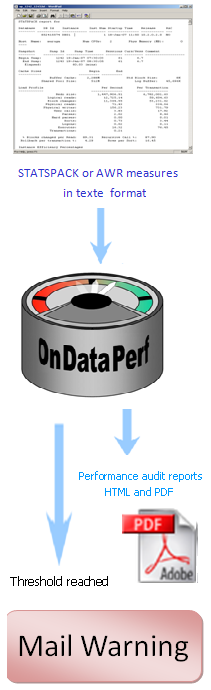
Utiliser la procédure suivante 1) Installation des outils de collecte (Statspack, AWR) 1) Installation des outils de collectes (statspack, AWR) Si cela est déjà fait, vous pouvez passer à l'étape suivante : Installer Statspack
“Installing and Configuring StatsPack Package Note:149113.1 NOTE METALINK STATSPACK”
Il est recommandé de faire une collecte statspack NIVEAU 7 au minimum. b) AWR est installé par défaut sur toute base 10g ou 11g. Les snaps se font par défaut toutes les heures. c) utlbstat, utlestat
a) Oracle : Utiliser the dbms_job
SQL> DECLARE jobno number; instno number; BEGIN SELECT instance_number INTO instno FROM v$instance; DBMS_JOB.SUBMIT(jobno, 'statspack.snap(i_snap_level => 7);', trunc(sysdate,'HH24')+((floor(to_number(to_char(sysdate,'MI'))/30)+1)*30)/(24*60), 'trunc(sysdate,''HH24'')+((floor(to_number(to_char(sysdate,''MI''))/30)+1)*30)/(24*60)', TRUE, instno); COMMIT; END; / On n'oubliera pas de positionner la variable job_queue_processes.
c) Windows : Création d'une tâche planifiée.
Il faut donc créer des rapports entre l'intervalle n et n+1 IL EST FORTEMENT RECOMMANDE d'UTILISER LES SCRIPTS FOURNIS PAR ONDATAFINE Sur toutes les plates-formes Ils fonctionnent à la fois sous Windows et UNIX. Nous fournissons un script équivalent pour
AWR 4)Se connecter au site www.ondataperf.com avec son compte et uploader le zip
Pour cela, si vous ne disposez pas de compte, il suffit d'aller dans le lien suivant Création de compte. Se connecter à votre compte ONDATAPERF avec login et mot de passe que vous avez reçu par mail. Si vous souhaitez disposer de ONDATAPERF premium ( payante ) avec beaucoup plus de fonctionnalités, il faut aller dans le Menu Abonnement en ligne. Aller dans le Menu Upload & Analyse..
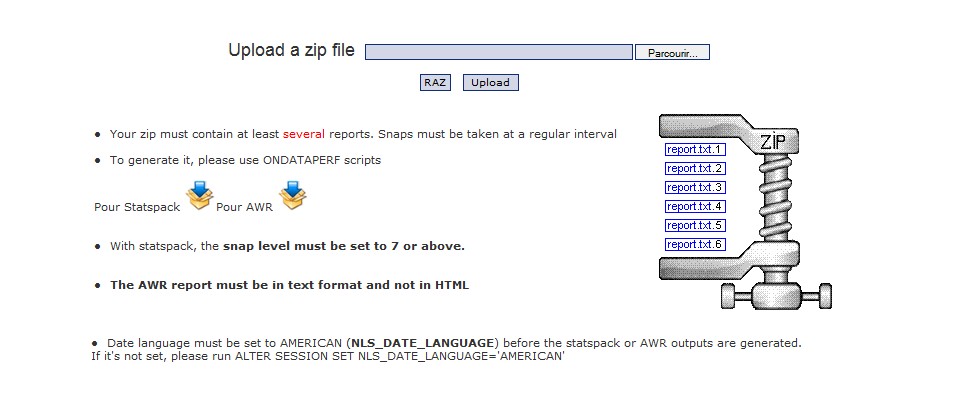
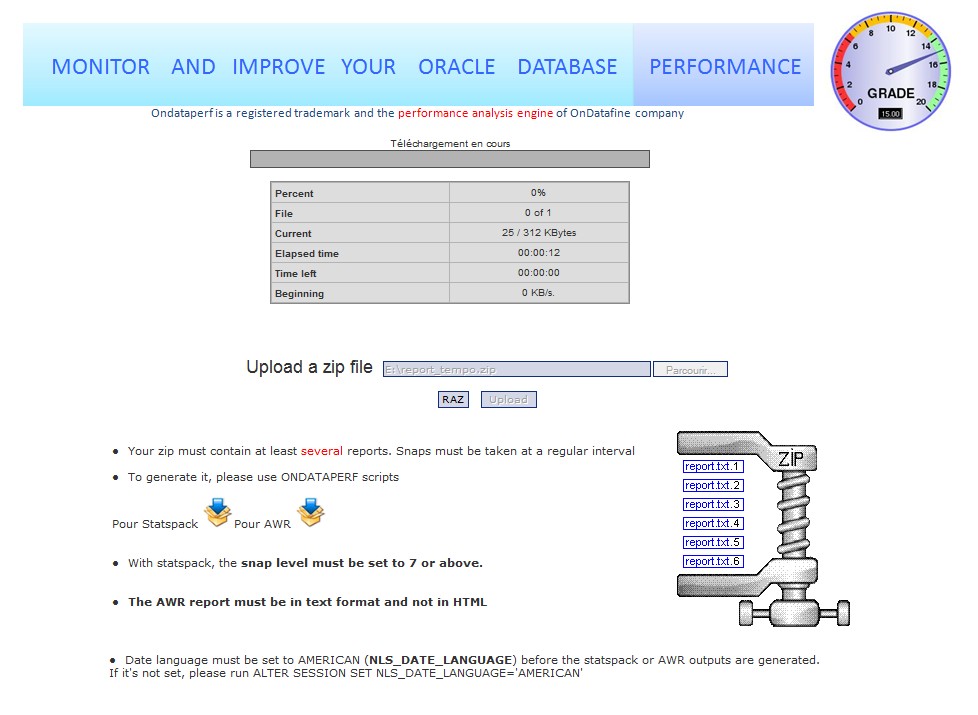
Choisissez un fichier à Uploader.
Une fois que le fichier est uploadé, ONDATAPERF fait une première analyse.
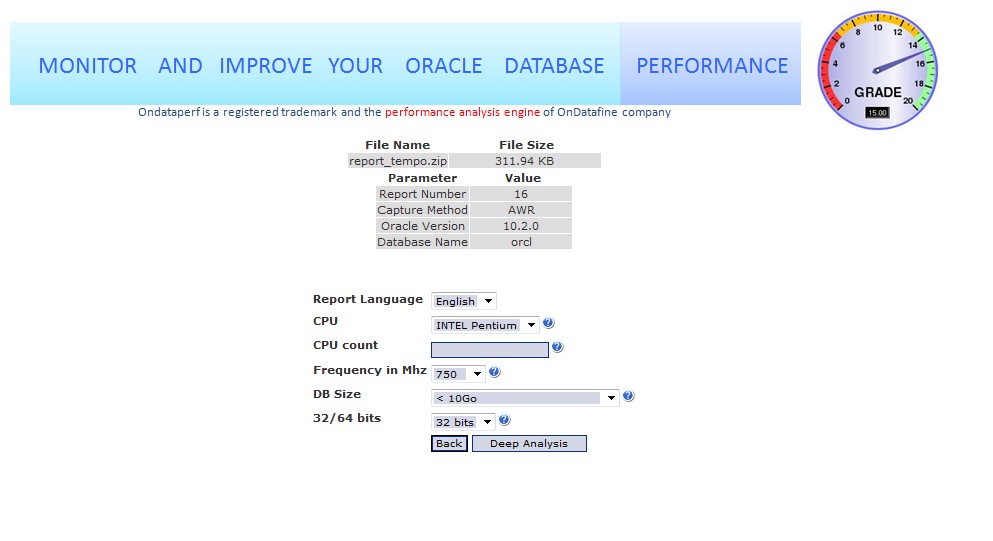
Il faut alors choisir la langue du rapport, le processeur, la fréquence la volumétrie. 32 ou 64 bits En cliquant sur "Analyse poussée, vous lancez la génération du rapport ONDATAPERF.
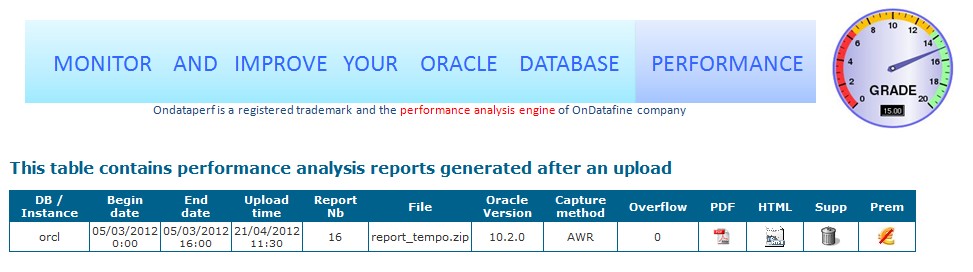
5) Obtenir le rapport ONDATAPERF Pour cela, Aller dans Le Menu "Mes rapports ONDATAPERF", vous disposez ainsi de la liste des rapports soit au format HTML ou PDF |